
Analyses
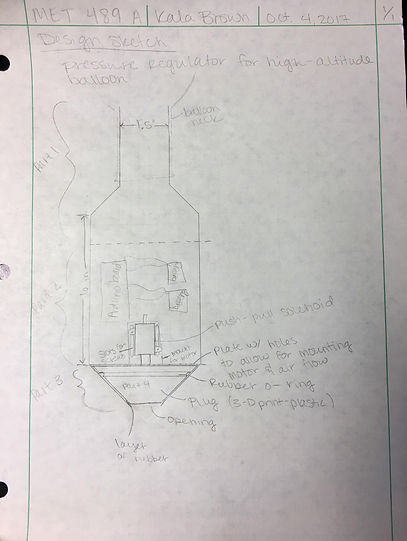
Figure 1 shows a rough sketch of the original design. This sketch shows the shape and dimensions of the device as well as a rough sketch of the components inside.
Figure 1: The image above depicts the original rough sketch of the mechanism.
It was required that the balloon remain floating between 75,000 and 80,000 feet. At these altitudes, the atmospheric pressure is very low. Therefore, it was necessary to calculate the precision required by the altimeter. Figure 2 shows calculations that were used to determine the design parameter of the altimeter.
From this analysis, it was determined that an altimeter that reads to one tenth of a kPa was needed. A barometric pressure/altitude/temperature sensor was found from adafruit.com that fits this design parameter, and will be used for this project. Documentation of this analysis can also be found in Appendix A.2 of the project report.
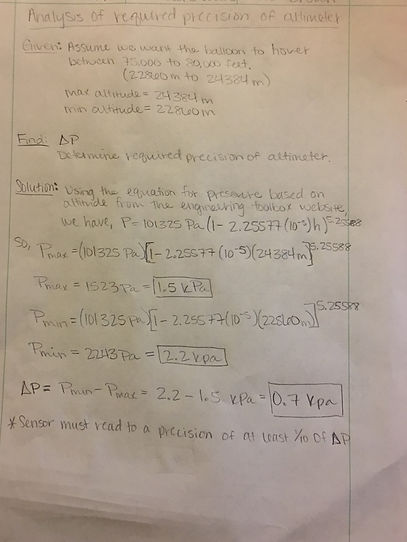
Figure 2: Analysis of required precision of altimeter.
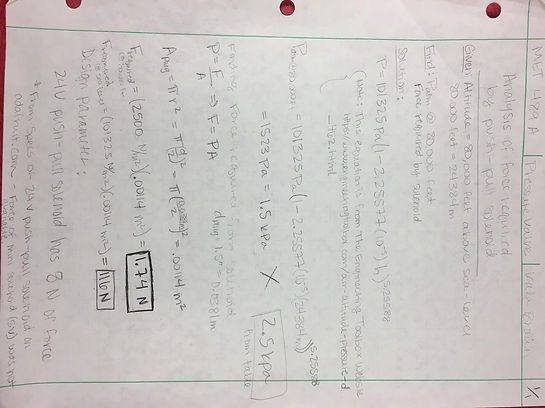
To the left, figure 3 depicts an analysis of the force required by the push-pull solenoid and can also be found in Appendix A.1 of the report. This analysis supports the requirement that the valve must hold helium with leakage no greater than 1% per hour and remain afloat at the desired altitude for at least 15 minutes. This analysis was completed by calculating the pressure at an altitude of 80,000 feet. From this pressure, the force required by the push-pull solenoid was calculated. This determined the design parameter of a push-pull solenoid capable of at least 1.7 N of force. Using this design parameter, it was decided that a 24-volt push-pull solenoid will be used, which provides up to 5 N of force.
Figure 3: Analysis of force required by push pull solenoid.
The images below contain an analysis of the payload supporting beam and can also be found in appendix A.3 of the report. For this analysis, it was assumed that the beam would be 1/8th of an inch in diameter. However, it was found that this diameter was too small, as the predicted deflection was too high.

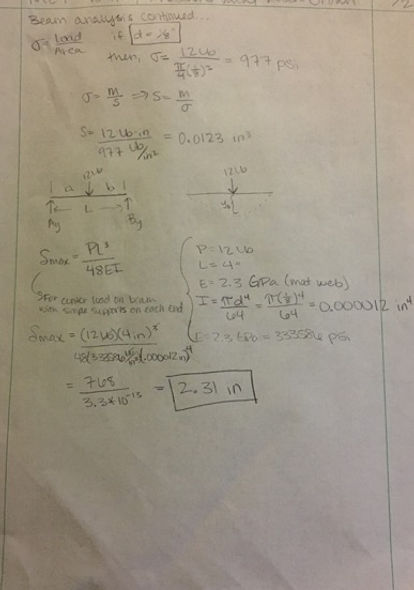
Figure 4: Initial Analysis of Payload Supporting Beam
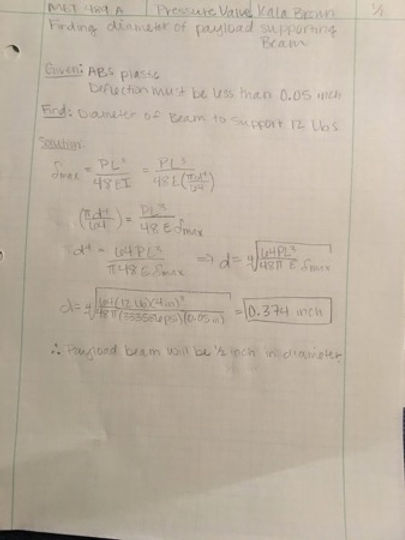
The image to the left shows the calculated required diameter of the beam and can also be found in appendix A.4 of the report. This analysis supports the requirement that the valve must be able to support at least 12 pounds of payloads. From this analysis, it was determined that the required diameter of the beam should be ½ inch. This can be found documented in appendix B.4, where it can be seen in the drawing of the payload supporting beam that the diameter of the beam was designed to be 0.5 inches.
Figure 5: Finding the diameter of the payload supporting beam.
Firgure 6 contains an analysis of the shear stress found where the beam connects to the valve housing. It was found that the yield stress of the material is greater than the shear stress at the connection. Therefore, it was determined that the diameter of 0.5 inch and material of ABS plastic would be appropriate for this design. This analysis can also be found in appendix A.5 of the report.
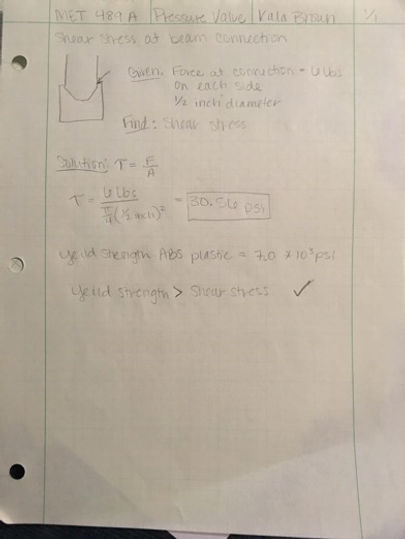
Figure 6: Shear stress at beam connection.
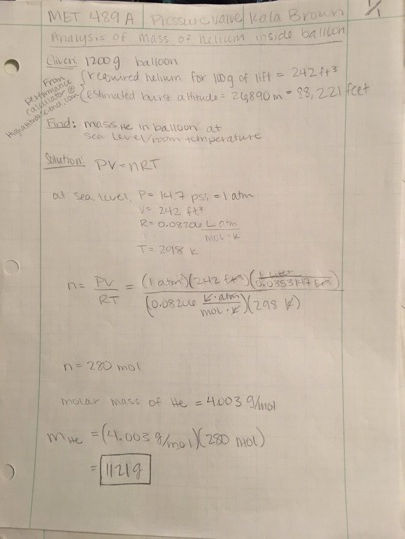
From the analysis of the mass of helium inside the balloon at sea level, it was determined that 1121 grams of helium would be needed to fill a balloon for testing. This analysis can also be found in appendix A.6 of the report.
This was used to estimate the budget, which can be found in appendix C of the report, and was also used to meet the requirement of costing less than $500 to design and manufacture.
Figure 7: Analysis of mass of helium inside balloon.
The image to the right is an analysis of the gauge pressure inside the balloon at sea level which can also be found in appendix A.7 of the report. This was going to be used to predict the pressure inside of the balloon at 70,000 feet, in order to determine the flow rate of helium when the valve was open. However, further testing involving blowing up a balloon with air and measuring the gauge pressure and pressure at burst was needed to determine the actual pressure inside of the balloon. Because of this, the helium flow rate was not calculated.
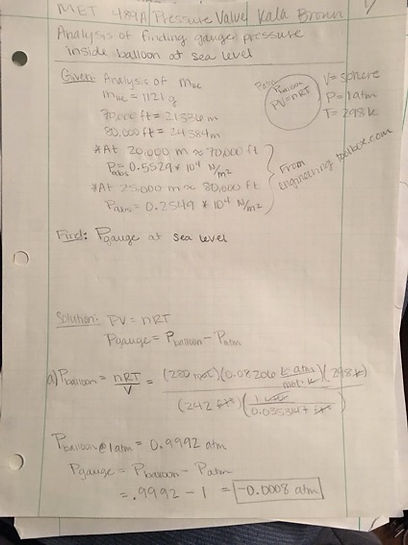
Figure 8: Calculating gauge pressure inside of balloon at sea level.
This image shows an analysis of the top portion of the payload supporting beam which can also be found in appendix A.8 of the report. From this analysis, a deflection of 0.0002 inches was predicted. The maximum deflection requirement was 0.05 inches, so it was determined that this design will fit the requirements.
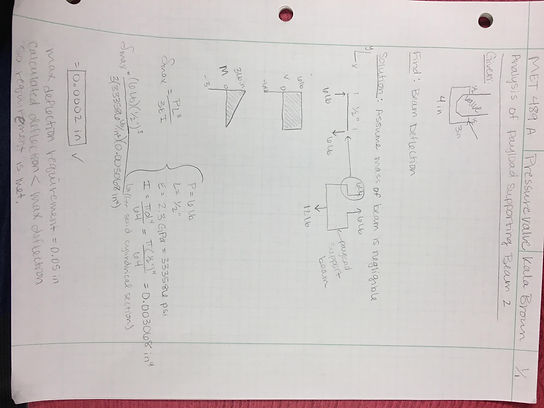
Figure 9: Calculating beam deflection.

Appendix A.9 of the report contains an analysis of the normal stress in the payload supporting beam, shown here in figure 10. A maximum stress of 30.6 psi was predicted. Since the tensile strength of ABS plastic is 3200 psi, it was predicted that this will meet the design requirements.
Figure 10: Calculating normal stress.
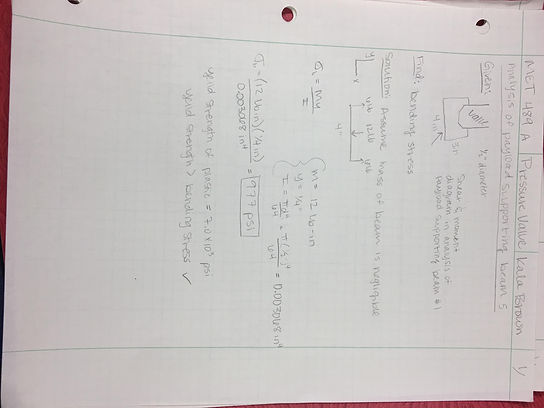
Figure 11 is an analysis of the bending stress in the payload beam which can also be found in appendix A.10 of the report. A bending stress of 977 psi was predicted. The yield strength of ABS plastic is 6000 psi. Therefore, it was predicted that this design would meet the requirements.
Figure 11: Calculating bending stress in beam.
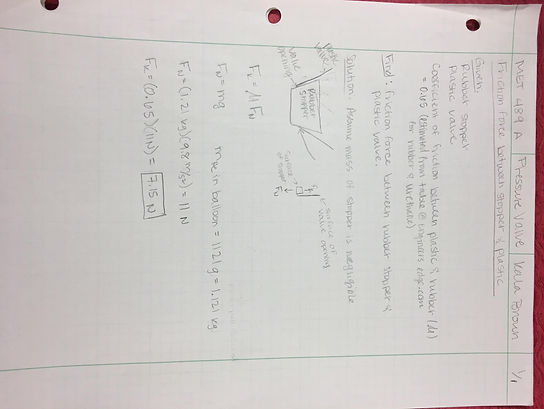
To calculate the total required force of the solenoid, the frictional force between the rubber stopper and the plastic valve opening was calculated. It is shown here in figure 12 and can also be found in appendix A.11 of the report. From this analysis, it was predicted that a frictional force of 7.15 N would exist between the stopper and the valve.
Figure 12: Calculating the friction force between the rubber stopper and plastic valve.

The total force required to lift the stopper was calculated to be 8.89 N. This analysis can also be found in appendix A.12 of the report.
Figure 13: Calculating the total force required by the solenoid to lift the rubber stopper.
During construction, it was found that the original plug was not going to work due to the solenoid only pulling up and not pushing down. Therefore, a new plug was designed. Figure 14 shown to the right, is an analysis of the required upward force from the solenoid to keep the valve shut. This analysis can also be found in appendix A.15 of the report.
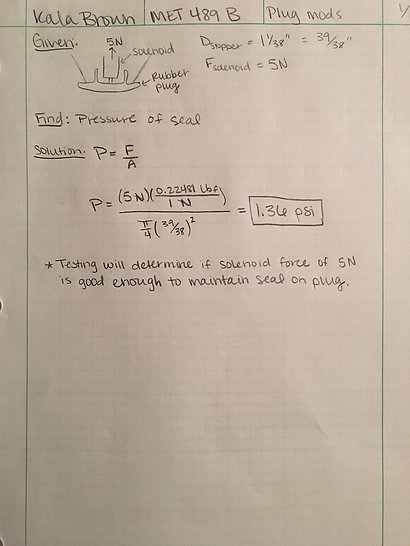
Figure 14: Calculating required solenoid force with modified plug.
Finite Element Analysis of Payload Support Beam
In order to assemble the beam, it had to be constructed in two pieces. Analyses were completed on how the beam pieces should be attached. These analyses can be found in the report in appendix A.13 through A.14.8. These analyses show finite element analyses of different attachment methods. The attachment methods analyzed were 3D printing one side of the beam with a 1/8th inch PLA plastic rod extending ¼ inch from the end to be inserted into a hole in the other side of the beam, using a ½ inch long and 1/8th inch diameter aluminum rod, and using a steel rod of the same size, respectively. All analyses were completed using Simulation Mechanical software and hand calculations to verify the results. The PLA plastic method was analyzed in 2D and 3D. The aluminum and steel rods were analyzed in 1D and 3D. Symmetry was used for each of these analyses.
Plastic rod
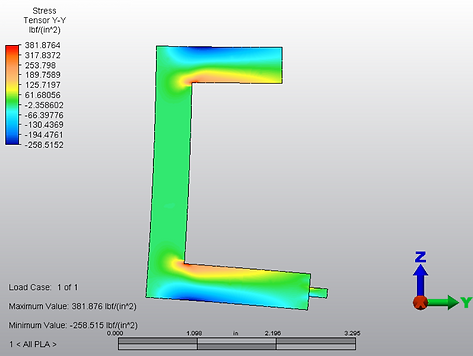
Figure 15: 2D FEA analysis of payload support beam.
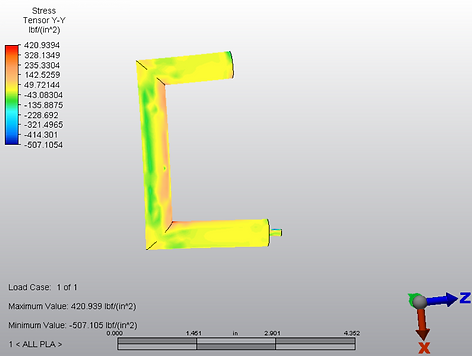
Figure 16: 3D FEA analysis of payload support beam.

Figure 17: Hand calculations in support of FEA analysis of beam.
The analyses in figures 15 through 17 show the plastic rod method. The 2D analysis (figure 15) of the PLA plastic method produced a maximum bending stress of 382 psi (Appendix A.13). The 3D analysis produced a maximum bending stress of 421 psi (Appendix A.13.1). Using a factor of 1.75, hand calculations produced a maximum bending stress of 427 psi (Appendix A.13.2). Therefore, the 2D analysis was within 1.4 % error and the 3D analysis was within 10% error. Since both analyses were within 10% or less, it was determined that these analyses were valid. The ultimate strength of the material (PLA plastic) was found from Matweb to be 2320 psi. Therefore, it was determined that this method would be suitable to support the weight of the payload without breaking.
Aluminum Pin
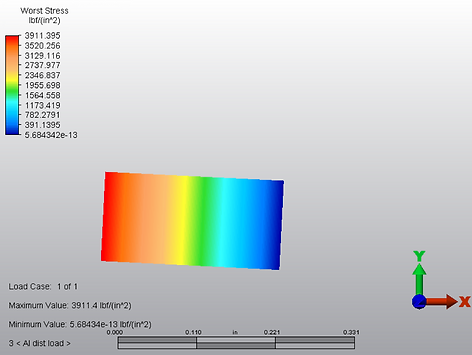
Figure 18: FEA analysis of aluminum pin using a 1D model with distributed load.

Figure 19: FEA analysis of aluminum pin using 3D model with distributed load.
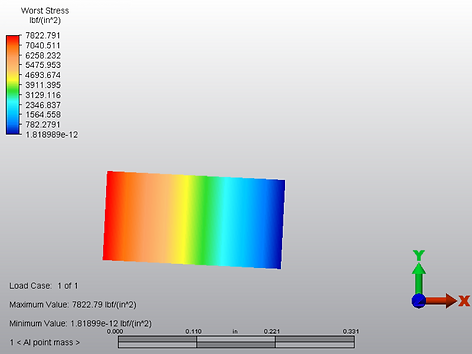
Figure 20: FEA analysis of aluminum pin using a 1D model with point load.
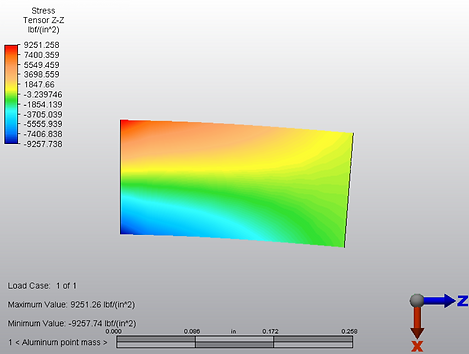
Figure 21: FEA analysis of aluminum pin using a 3D model with point load
The maximum bending stress from the 1D – point load analysis for the aluminum pin produced a max bending stress of 7823 psi and a 0% error when compared to the hand calculations. The 3D analysis produced a maximum bending stress of 9251 psi with a percent error of 9%. For the distributed load, the 1D analysis of the aluminum pin produced a maximum bending stress of 3911.4 psi and a percent error of 0%. The 3D analysis produced a max bending stress of 4639 psi and a percent error of 2.8%. The ultimate strength of Aluminum was found from Matweb to be 42,000 psi. Therefore, it was concluded that an aluminum pin would also allow for the beam to support the required load.
Steel Pin

Figure 22: FEA analysis of steel pin using a 1D model and distributed load.

Figure 24: FEA analysis of steel pin using a 1D model and point load.
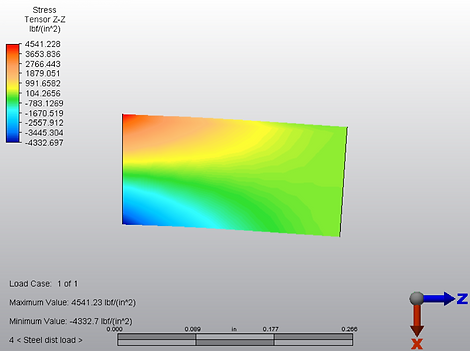
Figure 23: FEA analysis of steel pin using a 3D model and distributed load.
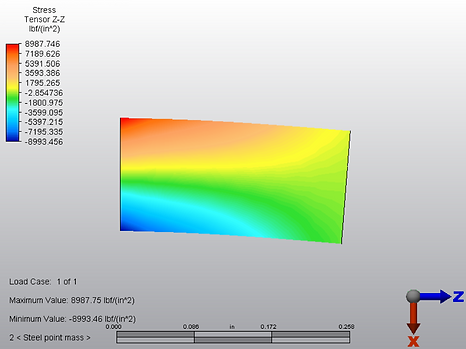
Figure 25: FEA analysis of steel pin using a 3D model and point load.
The 1D – point load analysis of the steel pin produced a maximum stress of 7823 psi and 0% error. The 3D – point load analysis produced a maximum stress of 8988 psi and 6% error. The distributed load produced values of 3911.4 psi with 0% error and 4541 psi with 0.5% error for 1D and 3D, respectively. Since each FEA analysis was within 10% error or less, the validity of these analyses was verified. From Matweb, the ultimate strength of steel was found to be 58,000 psi. Therefore, it was determined that a steel pin would also be appropriate for this application.
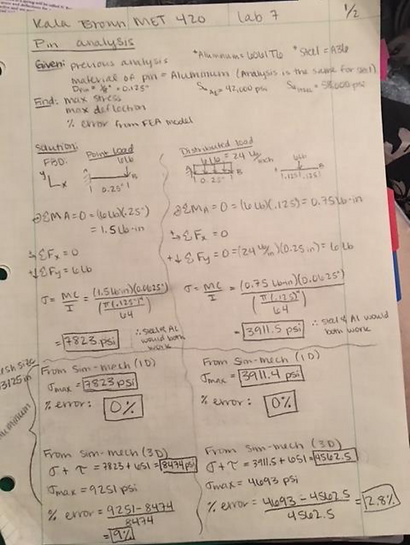
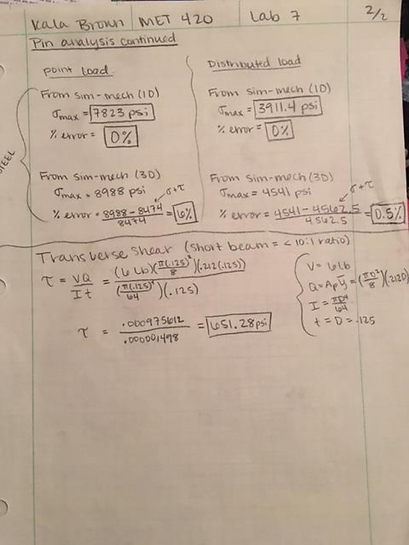
Figure 26: Hand calculations in support of FEA analyses of pin.
The hand calculations shown in figure 26 were the same for aluminum and steel and produced a bending stress value of 7823 psi for a point load and a bending stress of 3911.5 psi for a distributed load (Appendix A.14.8).
Based on the analyses discussed above, it was decided that an aluminum pin would work the best for this application, as it is stronger than the PLA plastic. Using the aluminum rod was also more cost effective, as aluminum rods of 1/8th inch diameter were available for donation from the CWU Physics department.